In the years from 1942 to 2012, the U. S. has enjoyed a 70-year heyday. After our build up for WWII, we became
the undisputed leader of the world in all military, economic, and influential
fronts. It seems fair to assume that we
have been doing things fairly well over the last 70 years, and any idea to
the contrary would be nothing short of experimental. So, instead of engaging in endless debate
about what is healthy for our economy, why don’t we compare our current numbers
to the 70 year average?
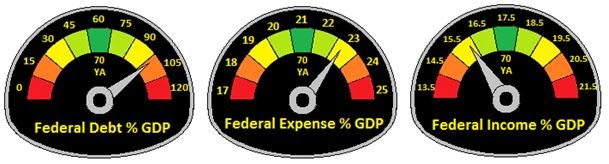
The big congressional debate is, once again, the debt ceiling. The National Debt is currently 103% of GDP, which is quite high compared to the 70 year average (70 YA) of only 62%, but not higher than after the war. Debt reduction is needed, but how? Conservatives say we need to cut costs, which is correct. Federal expenses are currently 22.8% of GDP, which is nearly 2% over the 70 YA. On the other hand, Liberals say we should increase taxes, which is also correct. Current Federal tax incomes are only 15.8% of GDP, nearly 2% below the 70 YA. The top tax rate of 35% is nearly
half the 70 YA. So, the reason our debt has grown at record rates is because congress is not raising taxes, or cutting costs, and both are sorely needed.
One thing that becomes apparent when we consider the 70 YA
of taxes and expenses is that, contrary to conservative opinion, the size of
government has not
grown out of control.
It is only 2% of GDP larger than the 70 YA, and well within the highs and
lows of the last 70 years. It is the
combination of expense overruns and low taxation that creates our swelling
deficits. We often hear about the need
for a balanced budget, which is also an overstatement. Spending has outpaced income for all of the
last 70 years, with just a few exceptions, Clinton's administration being the last. The average annual deficit has averaged about 3.3% of GDP, just slightly below the 70 YA rate of inflation at 3.9%.
What about unemployment? This figure is still quite high, and unemployment is a huge problem in America, right? To the contrary, this
appears to be false, because
overall
employment per capita (workforce) is at a comfortable 49.2%, a full 3.78% above
the 70 YA. That is to say,
more Americans are at work today than most of the 70 YA, and more than
any time
prior to 1988. Unemployment is a measure of
change in employment. In this case, we are comparing to the absolute
highest overall decade of employment in U. S. history (1996-2006). So, contrary to Tea Party rhetoric, America is not living off the government, and we do not need to be starved in order to go to work. We are not under employed. We just happen to be below
maximum employment.
So, if more of us are
working, why don’t we feel more successful?
We should, because our average household income of $68,000 is far better
than the 70 YA of only $52,800 (adjusted to 2012 dollars). Perhaps that is why Barack Obama had the gall
to say, “The middle class is doing fine.” On average, we make about 28% more than our
parents did.

So, let’s review: We
make more money than our parents did, and more of us have jobs than our parent’s
generation. We are taxed less than our parents, and the government spends
slightly more on programs than it did for our parents. Maybe it is time for us to think hard about
the real debt problem - modern greed. Tell
your congressman to
raise taxes,
and find sensible ways to cut the
budget
without taking benefits from the poor. This is the “balanced approach”
Obama spoke of last year. The trouble
with congress at this moment is that it doesn't want to do the right
thing. They certainly don't want everyone to know the President was right all along.
(Special thanks to my son, Marcel Fiore, for creating the
dashboard gauges.)
Tony F.
2013


 So, let’s review: We
make more money than our parents did, and more of us have jobs than our parent’s
generation. We are taxed less than our parents, and the government spends
slightly more on programs than it did for our parents. Maybe it is time for us to think hard about
the real debt problem - modern greed. Tell
your congressman to raise taxes, and find sensible ways to cut the
budget without taking benefits from the poor. This is the “balanced approach”
Obama spoke of last year. The trouble
with congress at this moment is that it doesn't want to do the right
thing. They certainly don't want everyone to know the President was right all along.
So, let’s review: We
make more money than our parents did, and more of us have jobs than our parent’s
generation. We are taxed less than our parents, and the government spends
slightly more on programs than it did for our parents. Maybe it is time for us to think hard about
the real debt problem - modern greed. Tell
your congressman to raise taxes, and find sensible ways to cut the
budget without taking benefits from the poor. This is the “balanced approach”
Obama spoke of last year. The trouble
with congress at this moment is that it doesn't want to do the right
thing. They certainly don't want everyone to know the President was right all along.